Data about data
I am a huge fan of gathering, analyzing and graphing data. Numbers and colorful charts just have something to them. But the actually interesting part is rarely the data itself, it's the data about the data. How often something happens, when it happens, between whom. Patterns sit in the metadata, not the content, and most of what makes a conversation a conversation can be reconstructed from the outside without ever reading a single message.
Let me show what I mean. The graphs below are weekday charts from two different WhatsApp chats of mine. No content, just message counts.
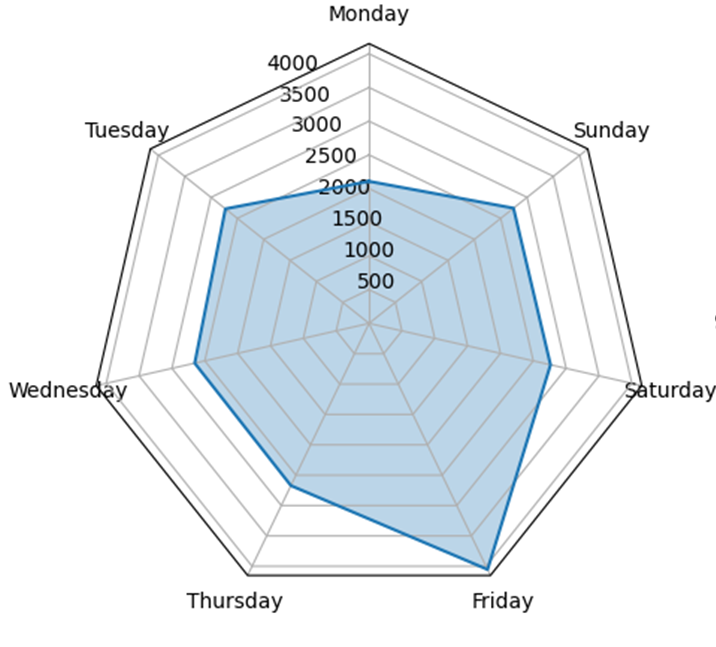
Weekdays Chat A
Weekdays Chat B
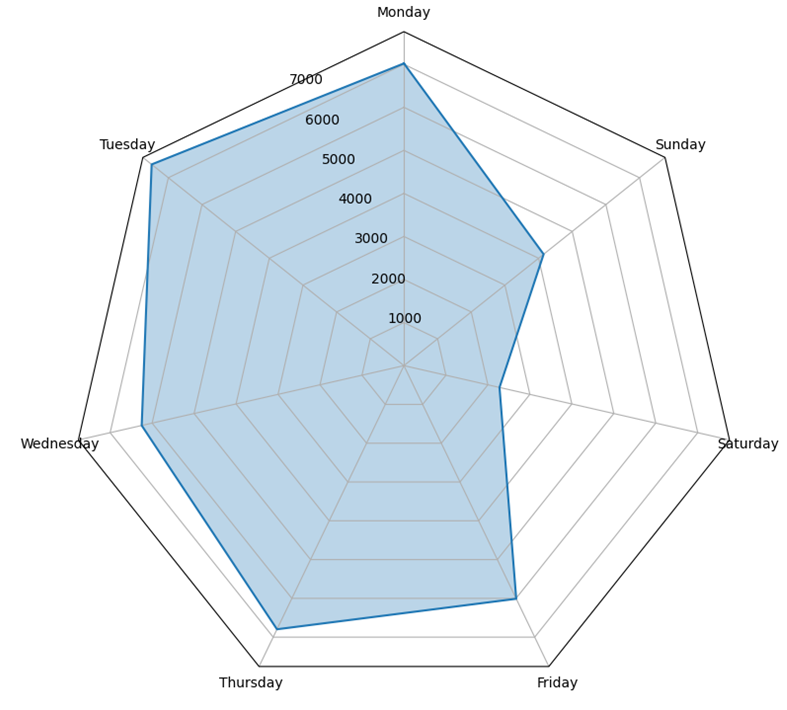
The difference between the two is not subtle. Chat A is roughly stable across the week, with two outliers on Friday and Monday. Could be a friend group planning what they're doing on the weekend. The total volume is also lower than B. Chat B has a huge gap between Sunday and Saturday and high volume on weekdays. Could be a work group, or it could be people who actually live in the same household and only need to text each other when they're apart.
I haven't told you a single thing about the messages. You already have a working theory of each chat. That is the part worth dwelling on.
Let's go a level deeper.
Days-Heatmap Chat A
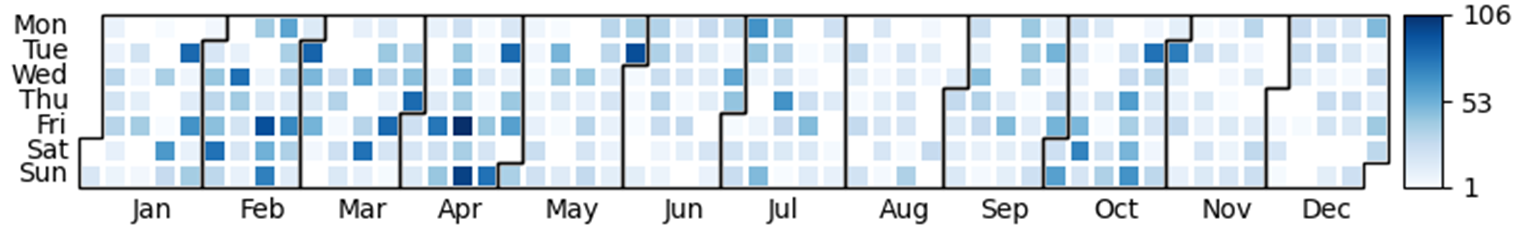
The group is most active between late January and May, with another spike in October. If you happen to live in Austria, this is recognizable. Schools have summer break from June to early September, Christmas break stretches through January, and there is a small break in November. So Chat A probably belongs to students who don't share classes during the school day. The breaks are quiet because they spend the time together in person. Nobody texts a person they're sitting next to. Right?
Days-Heatmap Chat B
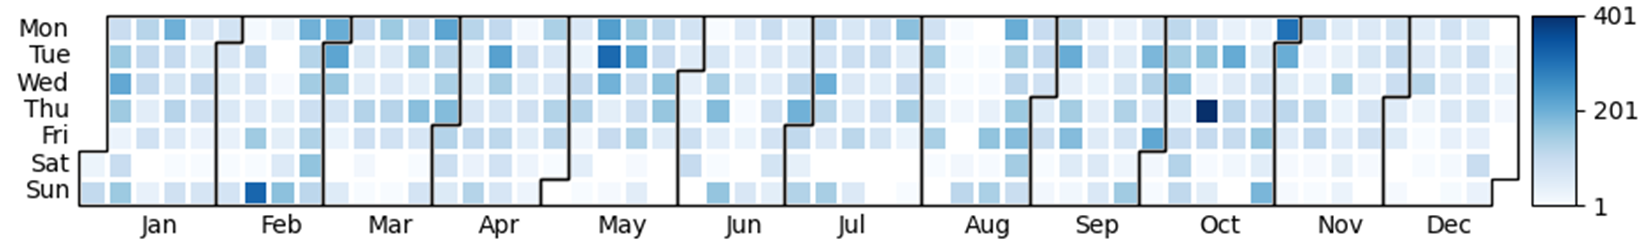
Volume stays roughly stable year-round, which fits the same-household theory. The dip in August could be a planned vacation.
It would be pretty unnerving if I told you all of those guesses turned out to be correct.
(They did.)
This is not a magic trick, by the way. I'm a CS student doing this at home with public-ish data and a few graphs. The actual surveillance operations doing this work for a living have orders of magnitude more signal to play with: contact graphs, timing correlations across many chats, data from the carrier, location pings, the whole stack. The home-graph version is the thinnest possible slice of what's actually doable.
The point isn't that metadata is kind of revealing. The point is that metadata is, in a lot of cases, more revealing than the content. Most people defend their messaging app choice on encryption: if nobody can read my messages, I am safe. The thing is, an attacker doesn't need to read a single message to learn most of what they want to know about you. Who you talk to, how often, when, in what rhythm, around which other events. That is already the vast majority of it.
Worth sitting with for a minute.
If you want to look more into this, Daniel Kriesel's 33c3 talk is the talk on the topic and probably the reason I think about it at all.
Comments